Analyzing Market Sentiment

Candle patterns are a crucial aspect of technical analysis in forex trading, offering traders insights into market sentiment and potential price movements. By interpreting the formations of candlesticks on a chart, traders can make more informed decisions about entry and exit points in the market.

Explore Candle Patterns with FX Pro Broker

At FXPro Broker, our advanced trading platforms offer a wide range of charting tools and indicators to help you identify and analyze candle patterns effectively. Whether you’re a novice trader learning the basics or an experienced professional refining your strategy, our resources and tools are designed to support your success in the forex market.


Bullish Engulfing Pattern

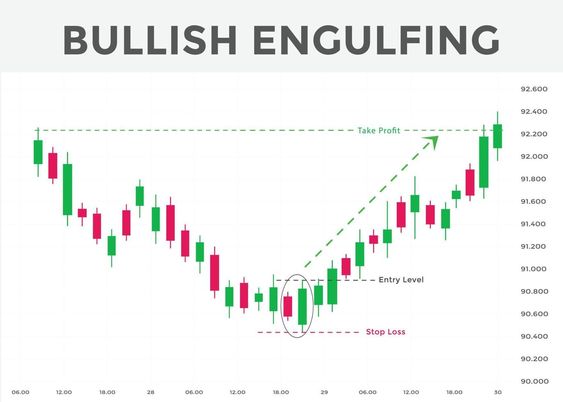
A bullish engulfing pattern occurs when a small bearish candle is followed by a larger bullish candle that completely engulfs the previous candle. This pattern indicates a potential reversal from a downtrend to an uptrend.
Implication: A strong buying signal, suggesting that the bulls are gaining control.

Bearish Engulfing Pattern

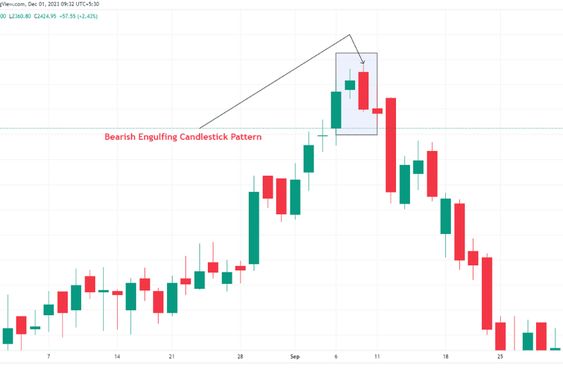
A bearish engulfing pattern forms when a small bullish candle is followed by a larger bearish candle that engulfs the previous candle. This pattern signals a possible reversal from an uptrend to a downtrend.
Implication: A strong selling signal, indicating that the bears are taking over.

Doji

A Doji candlestick forms when the opening and closing prices are nearly the same, resulting in a small or non-existent body. This pattern reflects market indecision.
Implication: A potential reversal signal, particularly when found at the top or bottom of a trend, indicating a possible shift in market direction.

Hammer and Hanging Man

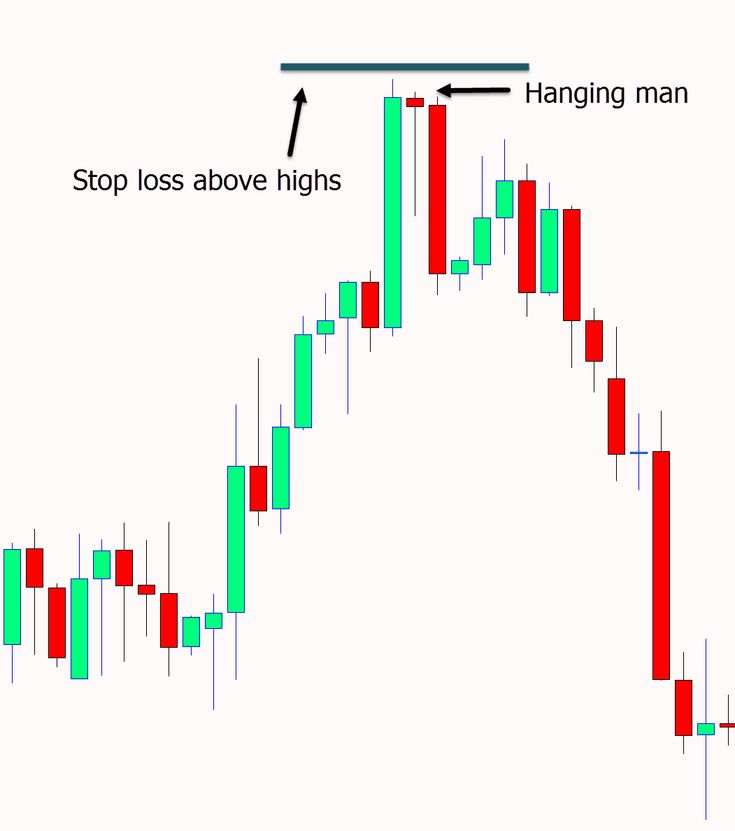
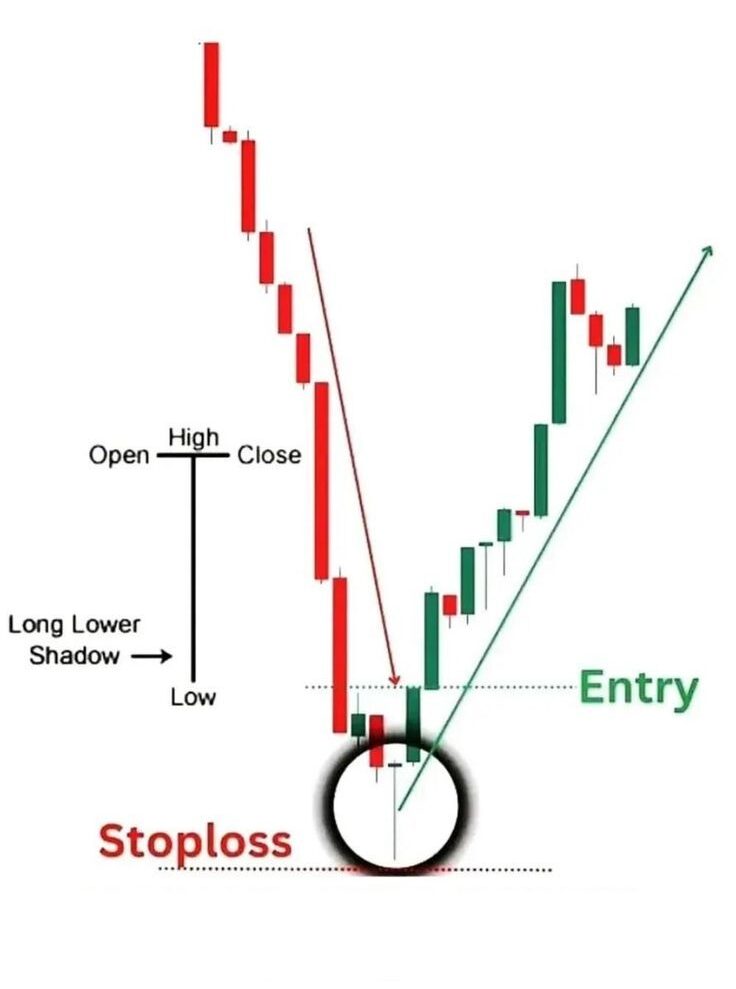
The hammer and hanging man patterns are similar in appearance, characterized by a small body at the top of the candle and a long lower shadow. The hammer appears in a downtrend and indicates a potential bullish reversal, while the hanging man appears in an uptrend, signaling a possible bearish reversal.
Implication: Both patterns suggest a potential reversal, with the hammer indicating buying pressure and the hanging man indicating selling pressure.

Morning Star and Evening Star

The morning star is a bullish reversal pattern that forms at the end of a downtrend, consisting of three candles—a long bearish candle, a small-bodied candle (indicating indecision), and a long bullish candle. The evening star is the bearish counterpart, forming at the end of an uptrend.
Implication: The morning star signals a potential uptrend, while the evening star indicates a possible downtrend.

Operational Address:

Brigade World Trade Center 142,Rajiv Gandhi Salai, Chennai, Tamil Nadu 600096

Risk Disclosure:

Trading foreign exchange on margin involves a significant level of risk and may not be suitable for all investors. Prior to engaging in forex trading, it is essential that you carefully evaluate your investment goals, experience level, and risk tolerance. There is a risk that you may incur losses that exceed your initial investment, and as such, you should only invest capital that you can afford to lose. It is crucial to fully understand the risks involved in foreign exchange trading and to consult with an independent financial advisor if you have any uncertain.

Disclaimer:

FX Pro Broker does not provide services to individuals or residents of the European Union, the United Kingdom, Australia, Canada, the United States, Cuba, Iraq, Myanmar, North Korea, and Sudan. Trading foreign exchange and other leveraged products carries a high level of risk and may not be suitable for all investors. Ensure that you fully understand the risks involved and seek independent advice if necessary. Only invest funds that you can afford to lose.